metrics
Help Page
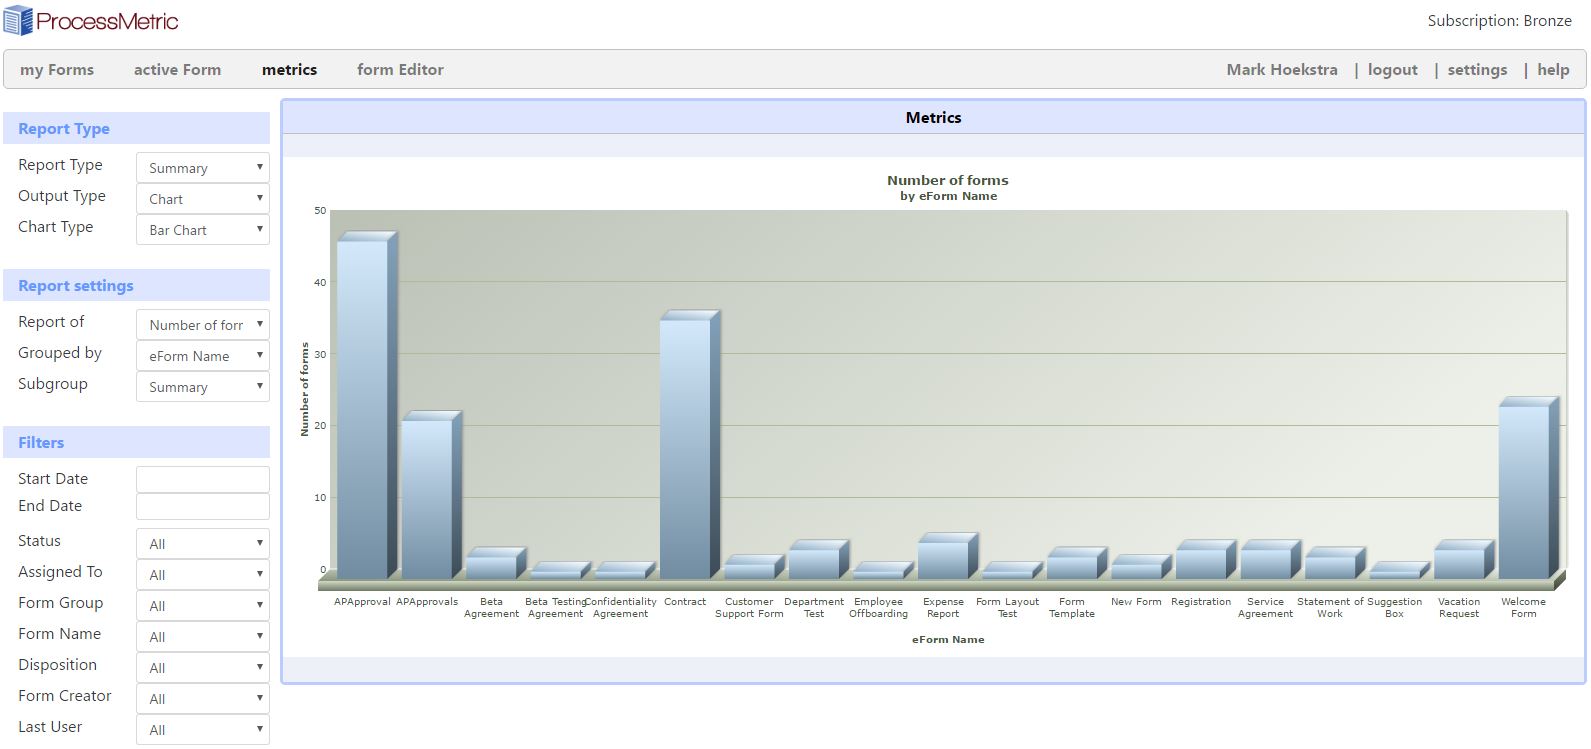
The metrics page is where you can gain insights into your business processes. Like most pages in ProcessMetric, the left menu is how you define the metrics.
Report Type is either summary (metrics on the processes themselves) or detail (metrics on the field data within the forms)
Chart Type will change the style of the chart (bar chart, pareto chart, pie chart, line chart)
Report Settings is how you can group and subgroup the forms for the summary report, and where you can define the field data you’d like to report about if detail report type is selected.
Filters will limit the data to specific data such as who created the report, whom it is assigned to, etc.